
We use Easy Digital Downloads to sell WP Fusion, and while it’s been good to us over the years, the reports leave a lot to be desired.
To get better insights into churn, MRR, and active customers growth, I’d been using ProfitWell, which does a nice job, but has a few issues:
- No PayPal support: It’s integrated directly with Stripe (not EDD). About 20% of our revenue comes from PayPal, so that data is missing.
- Discounts: When we offer discounts (for example on Black Friday), EDD charges in Stripe this as a one-off payment for the discounted price, with a free trial for a year, and then the regular subscription begins. This means that new customers who sign up with a discount count as “trials” and don’t count towards MRR.
- Upgrades: When EDD processes an upgrade (for example from Plus to Professional), it cancels the customer’s current subscription, charges a pro-rated upgrade fee as a one-off, and then creates a new trialing subscription until the customer’s scheduled renewal date. In ProfitWell this counts as both a churned subscription and a trial— neither of which are true.
So, while we can spot some trends in ProfitWell, it’s far from accurate, especially with predicting recurring revenue.
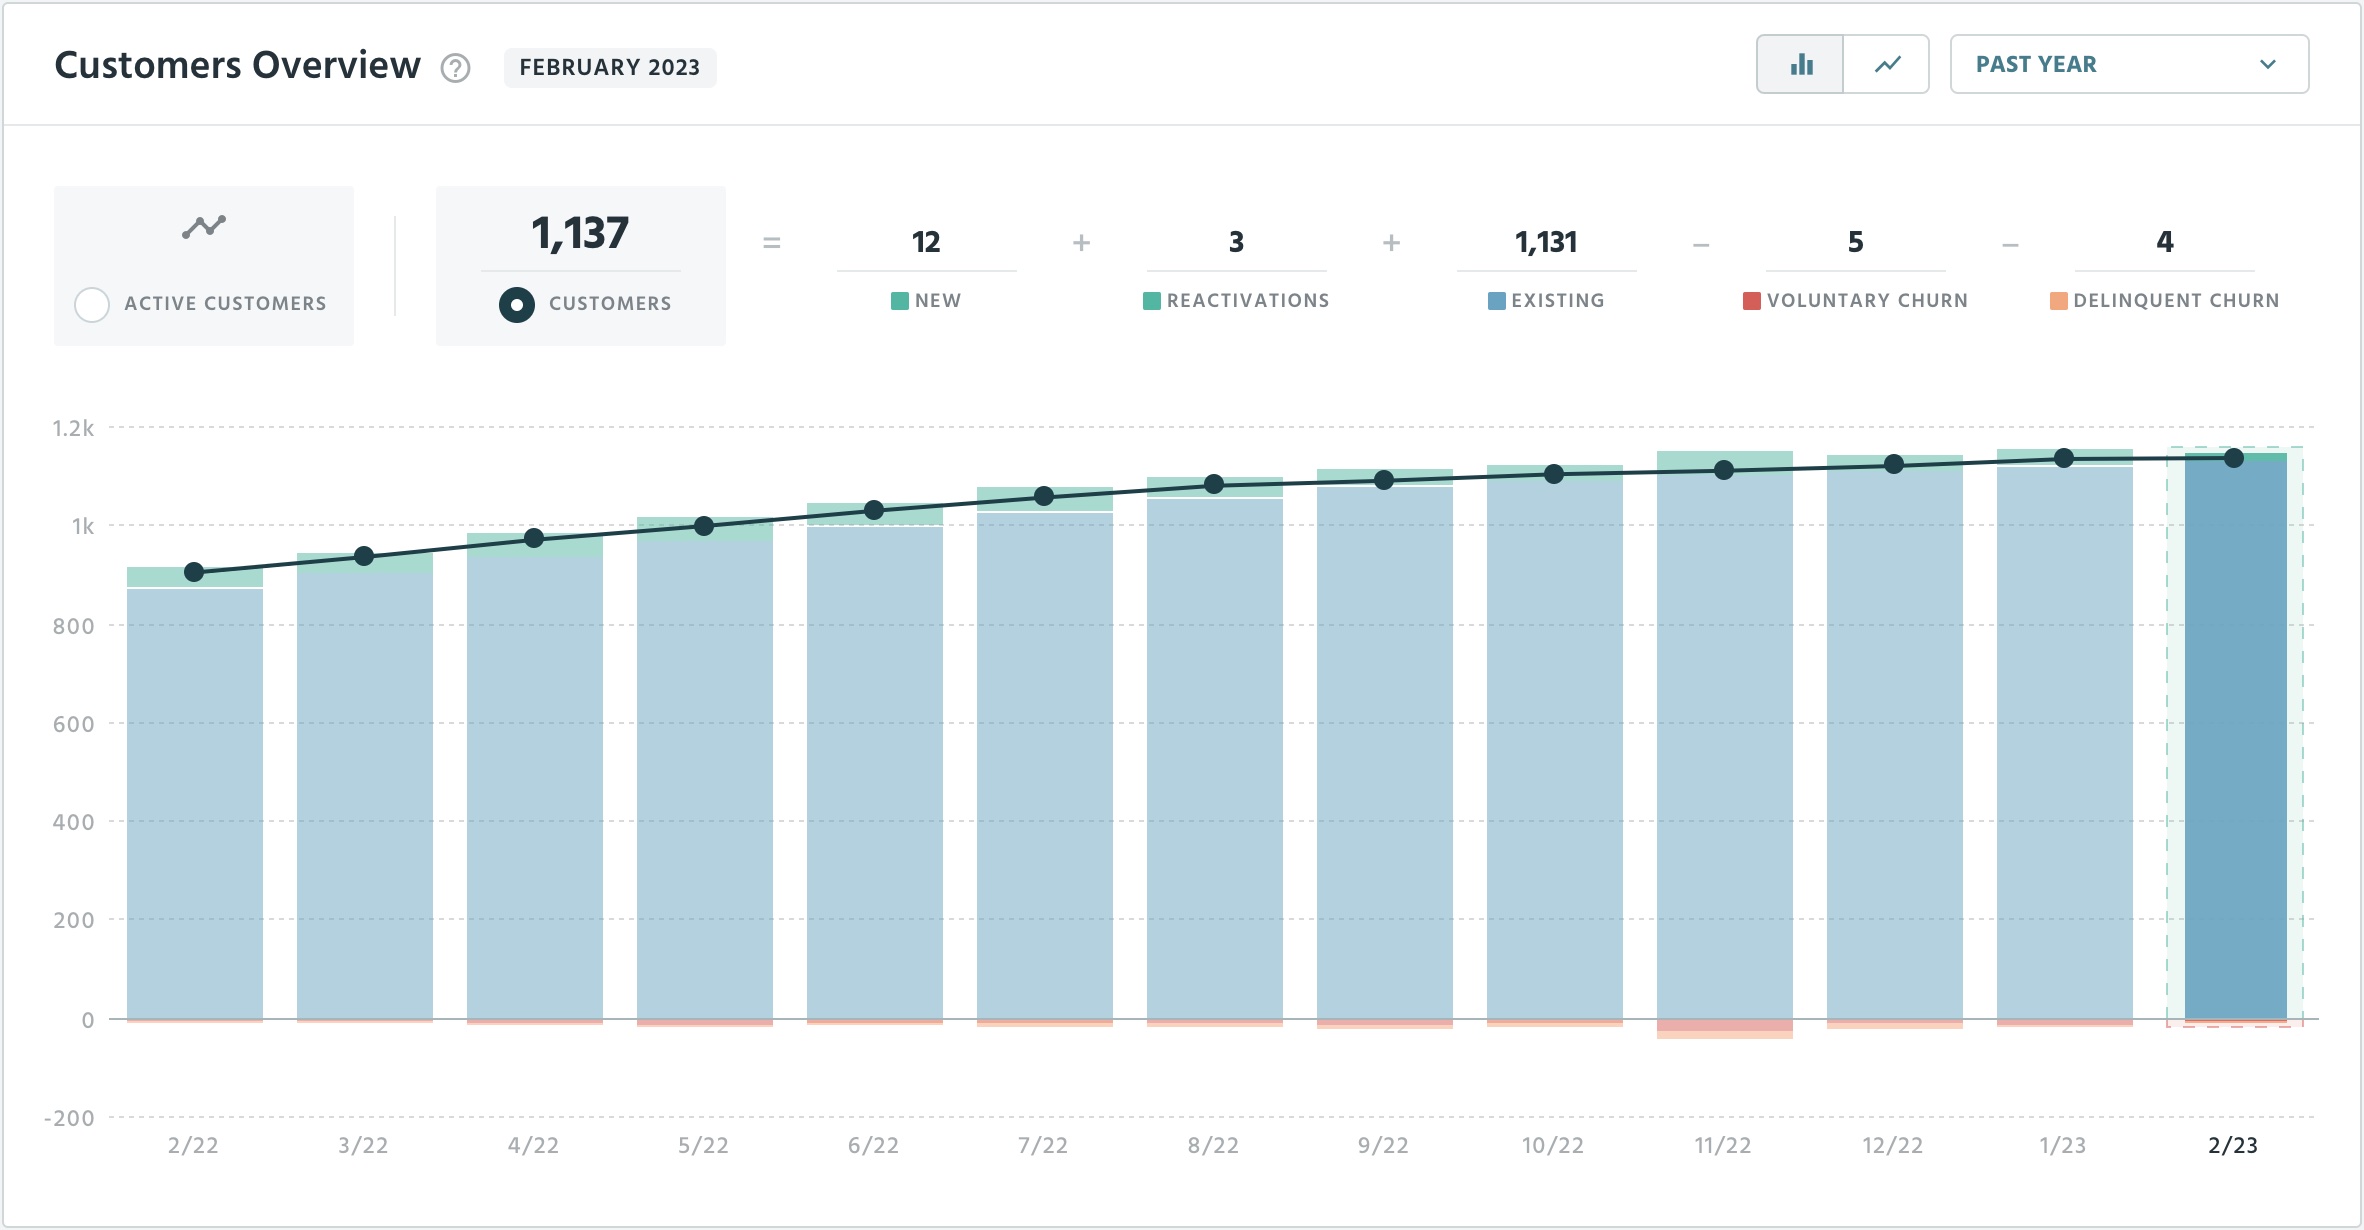
For example look at the active customers count difference between ProfitWell and EDD— 1,137 in ProfitWell vs 2,154 in EDD. Not even close, yikes! 😬

In search of a solution
Every year, I publish a Year in Review for WP Fusion where we go through a bunch of metrics.
This is a fun way to “build in public”, and it’s also a good chance to spend some time reviewing everything internally, to try and identify weaknesses, etc.
In years prior, I’d done all of this “by hand”— exporting the EDD order data as .csvs, and between a few different spreadsheet apps and having to re-learn what a pivot table is, I’d come up with some pretty charts.
Of course this is very time consuming, and the data quickly gets stale.
Bringing in help 🤖
This year I was messing around with ChatGPT and thought, hey, maybe it can help me with some of these reports. And, surprise, surprise, it turned out to be very helpful! 🤩
Great, I’ve got a way to query the data, now just how to display it…
In the past I’ve worked with Klipfolio, and I briefly experimented with their new PowerMetrics tool, but I didn’t really love the UI, or the way that each query needed to be configured with its own connection to our database.
Appsmith
I ended up using Appsmith, which I like for a few reasons:
- It’s open source (like us!) with an option to self-host
- They have a free cloud plan
- The charts are built using FusionCharts which means if we need something not supported in the UI, we can code it (or have ChatGPT code it for us 😈)
- Projects can be synced to Github, making it easy to share and collaborate (our repo for this project is here)
Bringing it all together
The process is pretty easy:
- Figure out what you want to know about your data
- Ask ChatGPT to write the query
- Test it in AppSmith, refine as needed (ChatGPT does well but it often needs to be corrected or coached a bit)
- Drop a chart onto a page
- Customize the chart JS config to get the right look and feel
Once I got in the rhythm, things went pretty fast, and now we have 34 new BI charts that are updating in real time from our EDD store 🎉.
How much does the AI contribute?
I’d say ChatGPT takes me from an intermediate developer to an advanced one, in terms of SQL.
The best results come out of clear prompts, which means you need to know a bit about your data and how it’s organized.
For example:
I need an SQL query that will sort my Easy Digital Downloads customers by lifetime value.
☝️ this doesn’t work.
ChatGPT makes up the table names, columns, and doesn’t understand their relationships with each other.
But, if you’re clear, it can be really powerful.
Here’s an updated prompt:
Let me give you some more information.
My customers are stored in the
wp_edd_customerstable. Each customer has an ‘id’ and ’email’. My orders are stored in thewp_edd_orderstable.Each order has a ‘customer_id’ which corresponds to the ‘id’ from the
wp_edd_customers. Each order also has a ‘total’, and a ‘status’.I’d like the report to output my top 10 customer email addresses based on their lifetime order value. Orders with a status of ‘refunded’ should be excluded.
Can you give me the SQL for this?
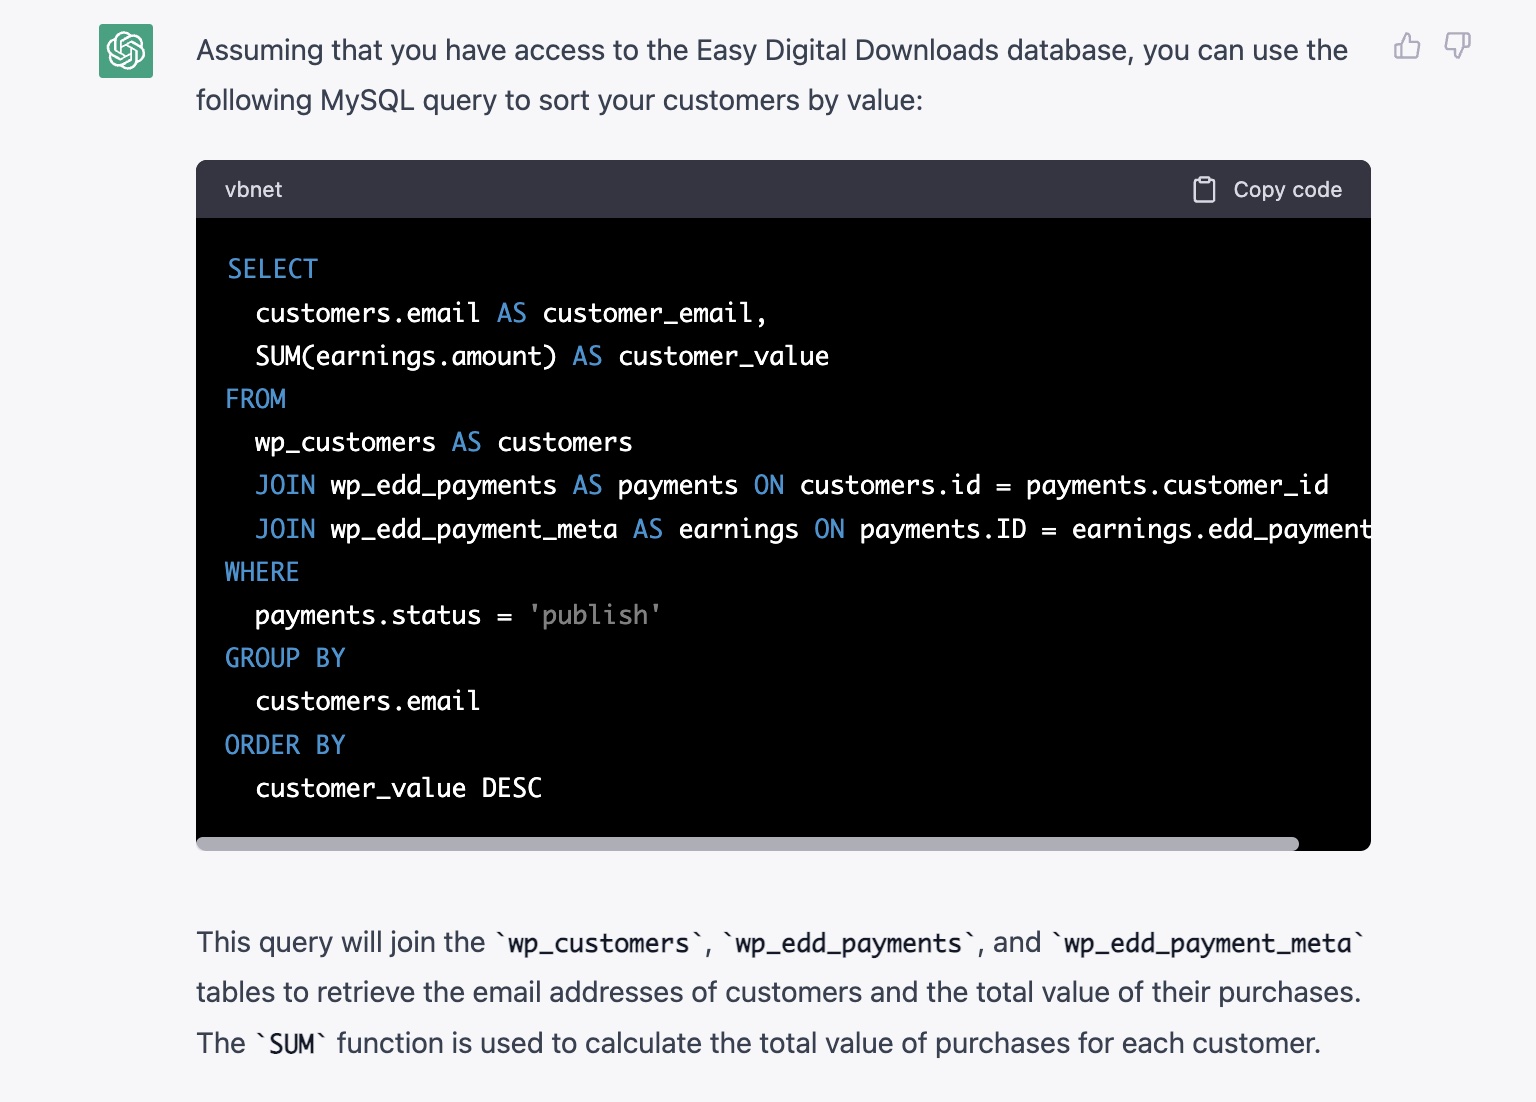
Then we get a helpful result:

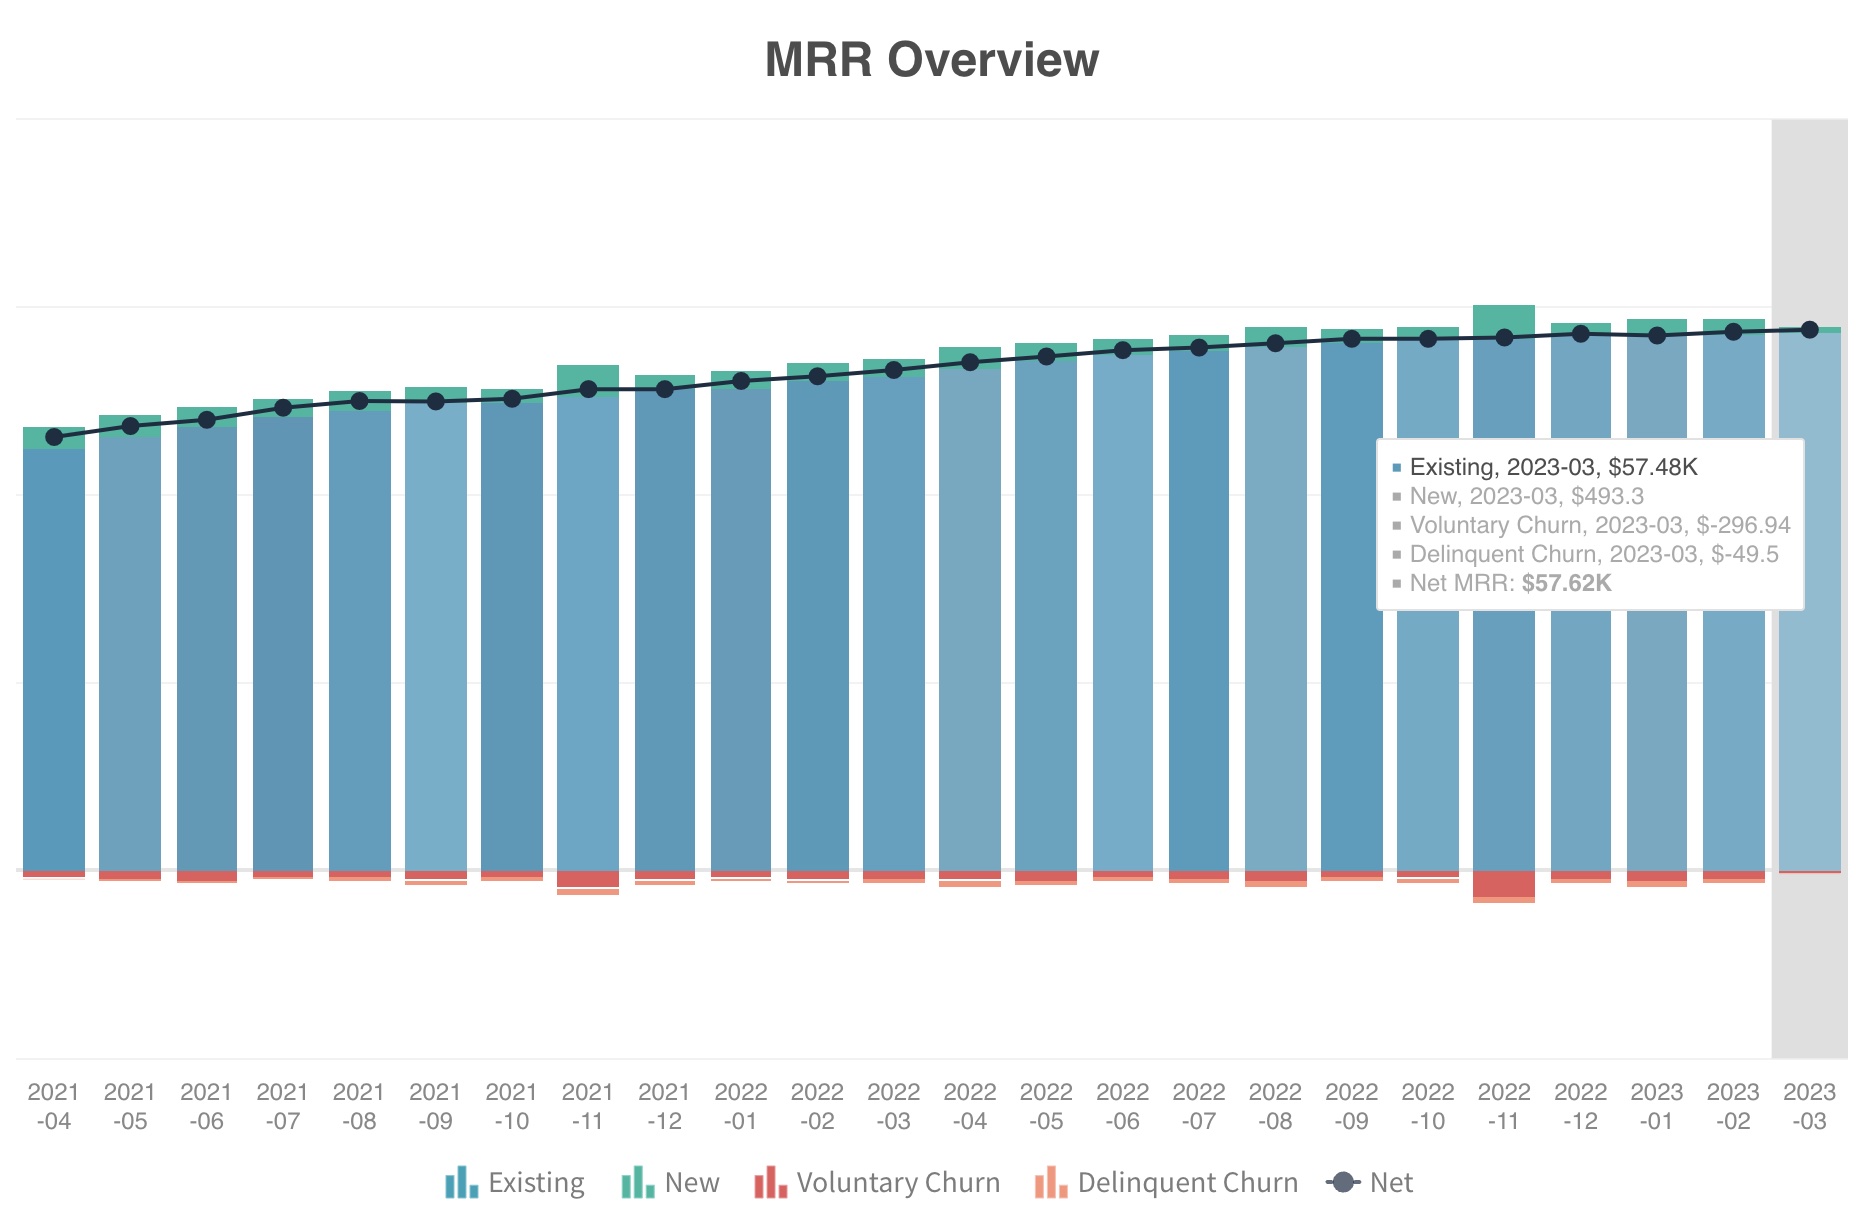
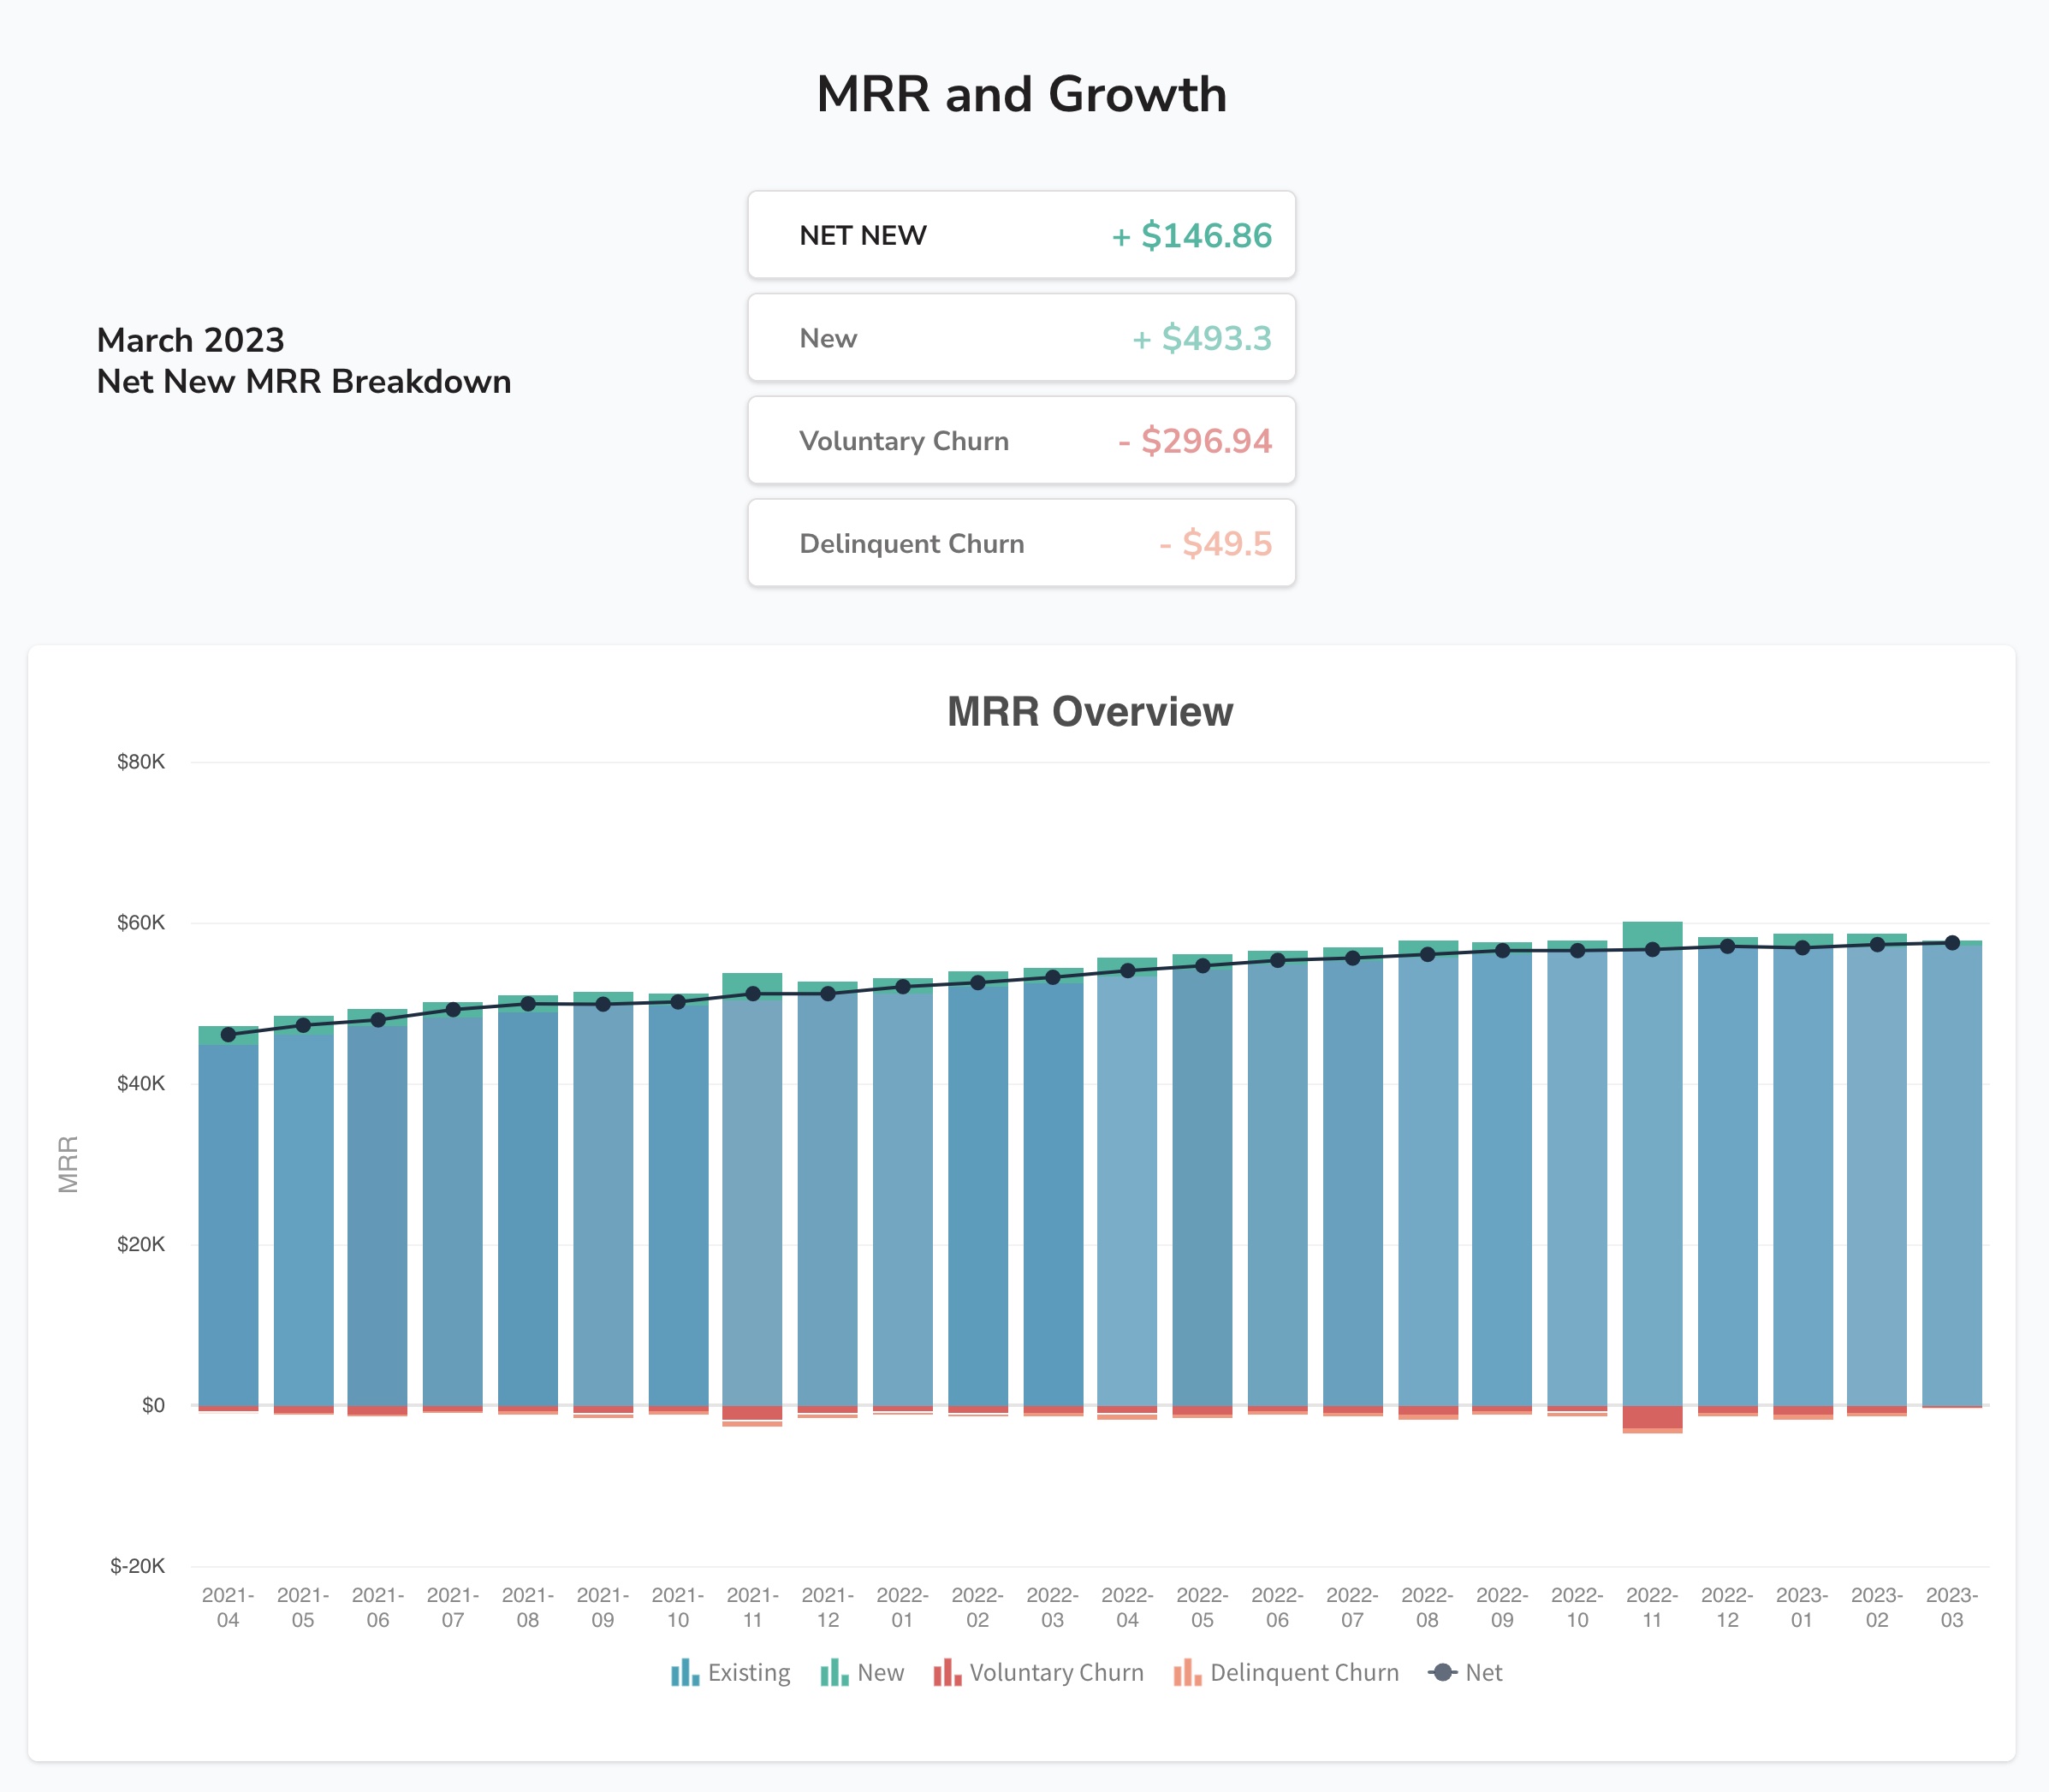
The most complicated query we came up (yes, we 😅🤖) calculates existing MRR by month.
The logic is:
- For each of the prior 24 months
- count the subscribers who were created or made a renewal payment in the 12 month period prior,
- (who did not have a refund)
- then calculate their MRR either based on their initial payment amount or recurring payment amount depending on whether or not it was the first year of their subscription
- and divide by 12.
That came out like
SELECT
  DATE_FORMAT(months.first_day, '%Y-%m') AS month,
  COUNT(DISTINCT s.id) AS subscriptions,
  ROUND( SUM(
    CASE
      WHEN s.created >= DATE_SUB(s.created, INTERVAL 12 MONTH) THEN
        s.initial_amount / 12
      ELSE
        s.recurring_amount / 12
    END
  ), 2 ) AS mrr
FROM
  wp_edd_subscriptions AS s
  JOIN (
    SELECT
      DATE_FORMAT(DATE_SUB(NOW(), INTERVAL n MONTH), '%Y-%m-01') AS first_day
    FROM
      (SELECT 0 AS n UNION ALL SELECT 1 UNION ALL SELECT 2 UNION ALL SELECT 3 UNION ALL SELECT 4 UNION ALL SELECT 5 UNION ALL SELECT 6 UNION ALL SELECT 7 UNION ALL SELECT 8 UNION ALL SELECT 9 UNION ALL SELECT 10 UNION ALL SELECT 11 UNION ALL SELECT 12 UNION ALL SELECT 13 UNION ALL SELECT 14 UNION ALL SELECT 15 UNION ALL SELECT 16 UNION ALL SELECT 17 UNION ALL SELECT 18 UNION ALL SELECT 19 UNION ALL SELECT 20 UNION ALL SELECT 21 UNION ALL SELECT 22 UNION ALL SELECT 23) AS n
  ) AS months
	ON
  (s.created < months.first_day AND
  (s.expiration >= months.first_day))
WHERE
  NOT EXISTS (
    SELECT
      1
    FROM
      wp_edd_orders
    WHERE
      ( parent = s.parent_payment_id OR id = s.parent_payment_id )
			AND status = 'refunded'
  )
GROUP BY
  month;
😰 that one took a fair bit of trial and error, and I’m still only 90% confident in the accuracy, but it’s far beyond what I could have come up with on my own 🚀.
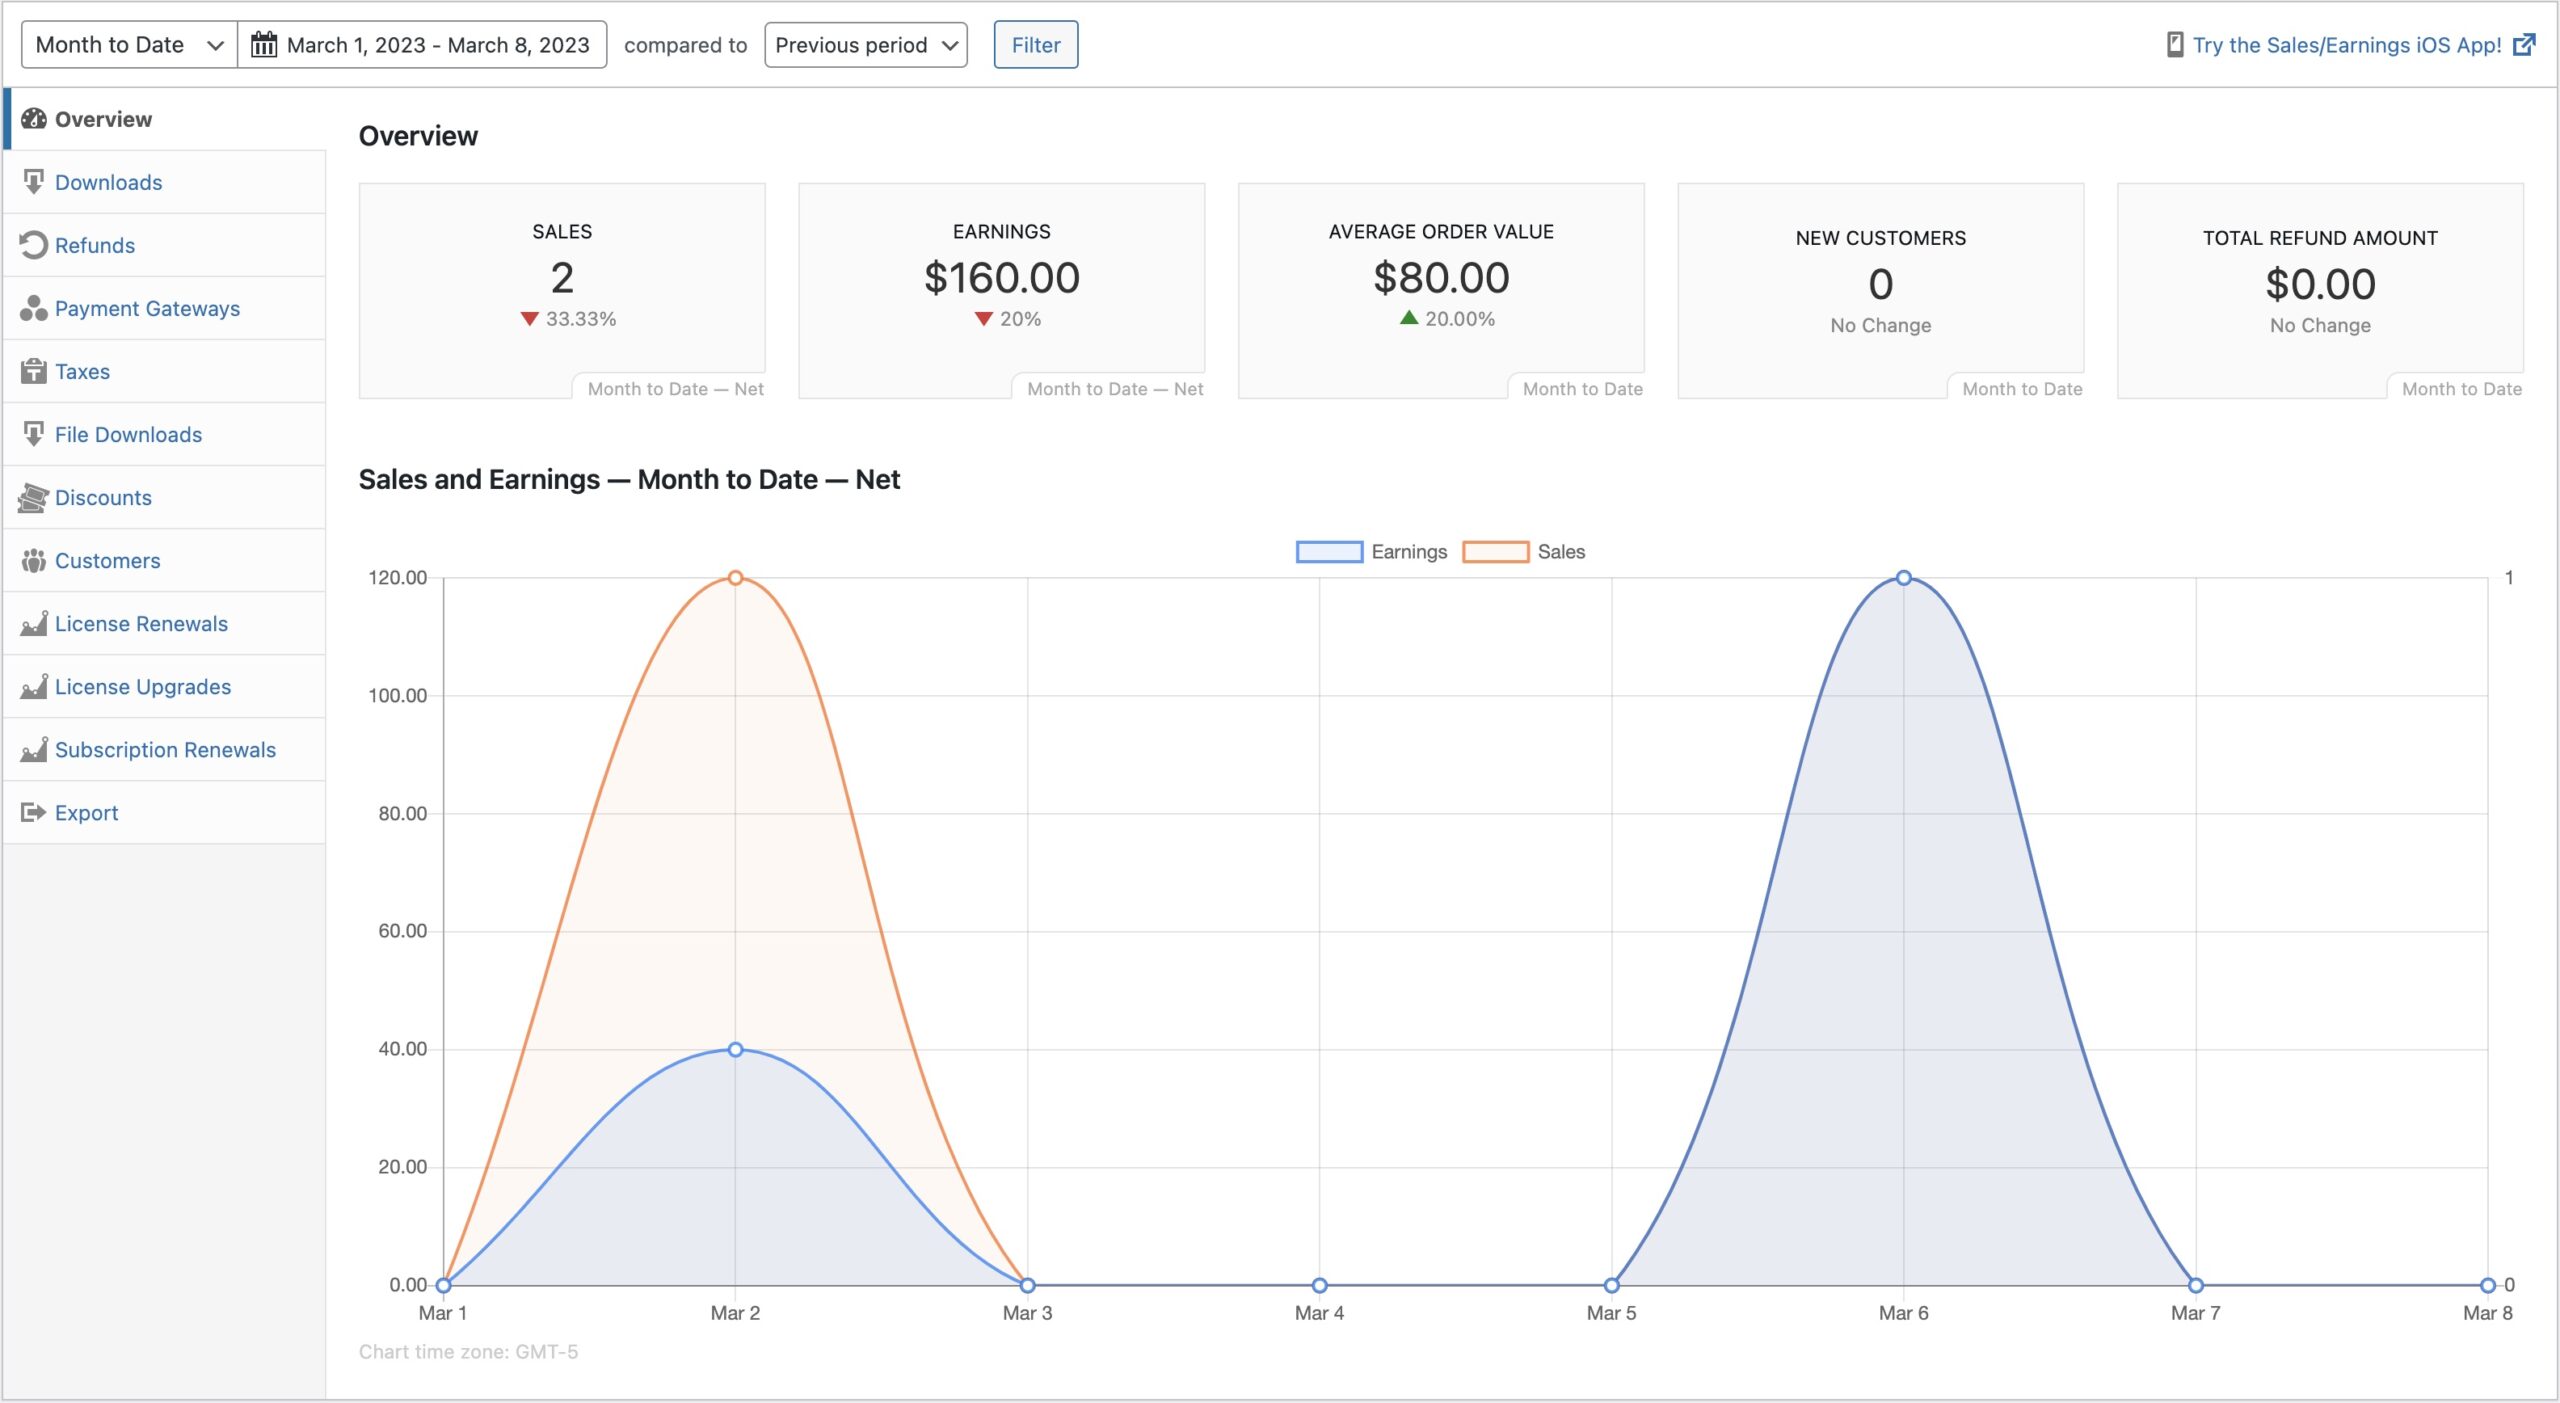
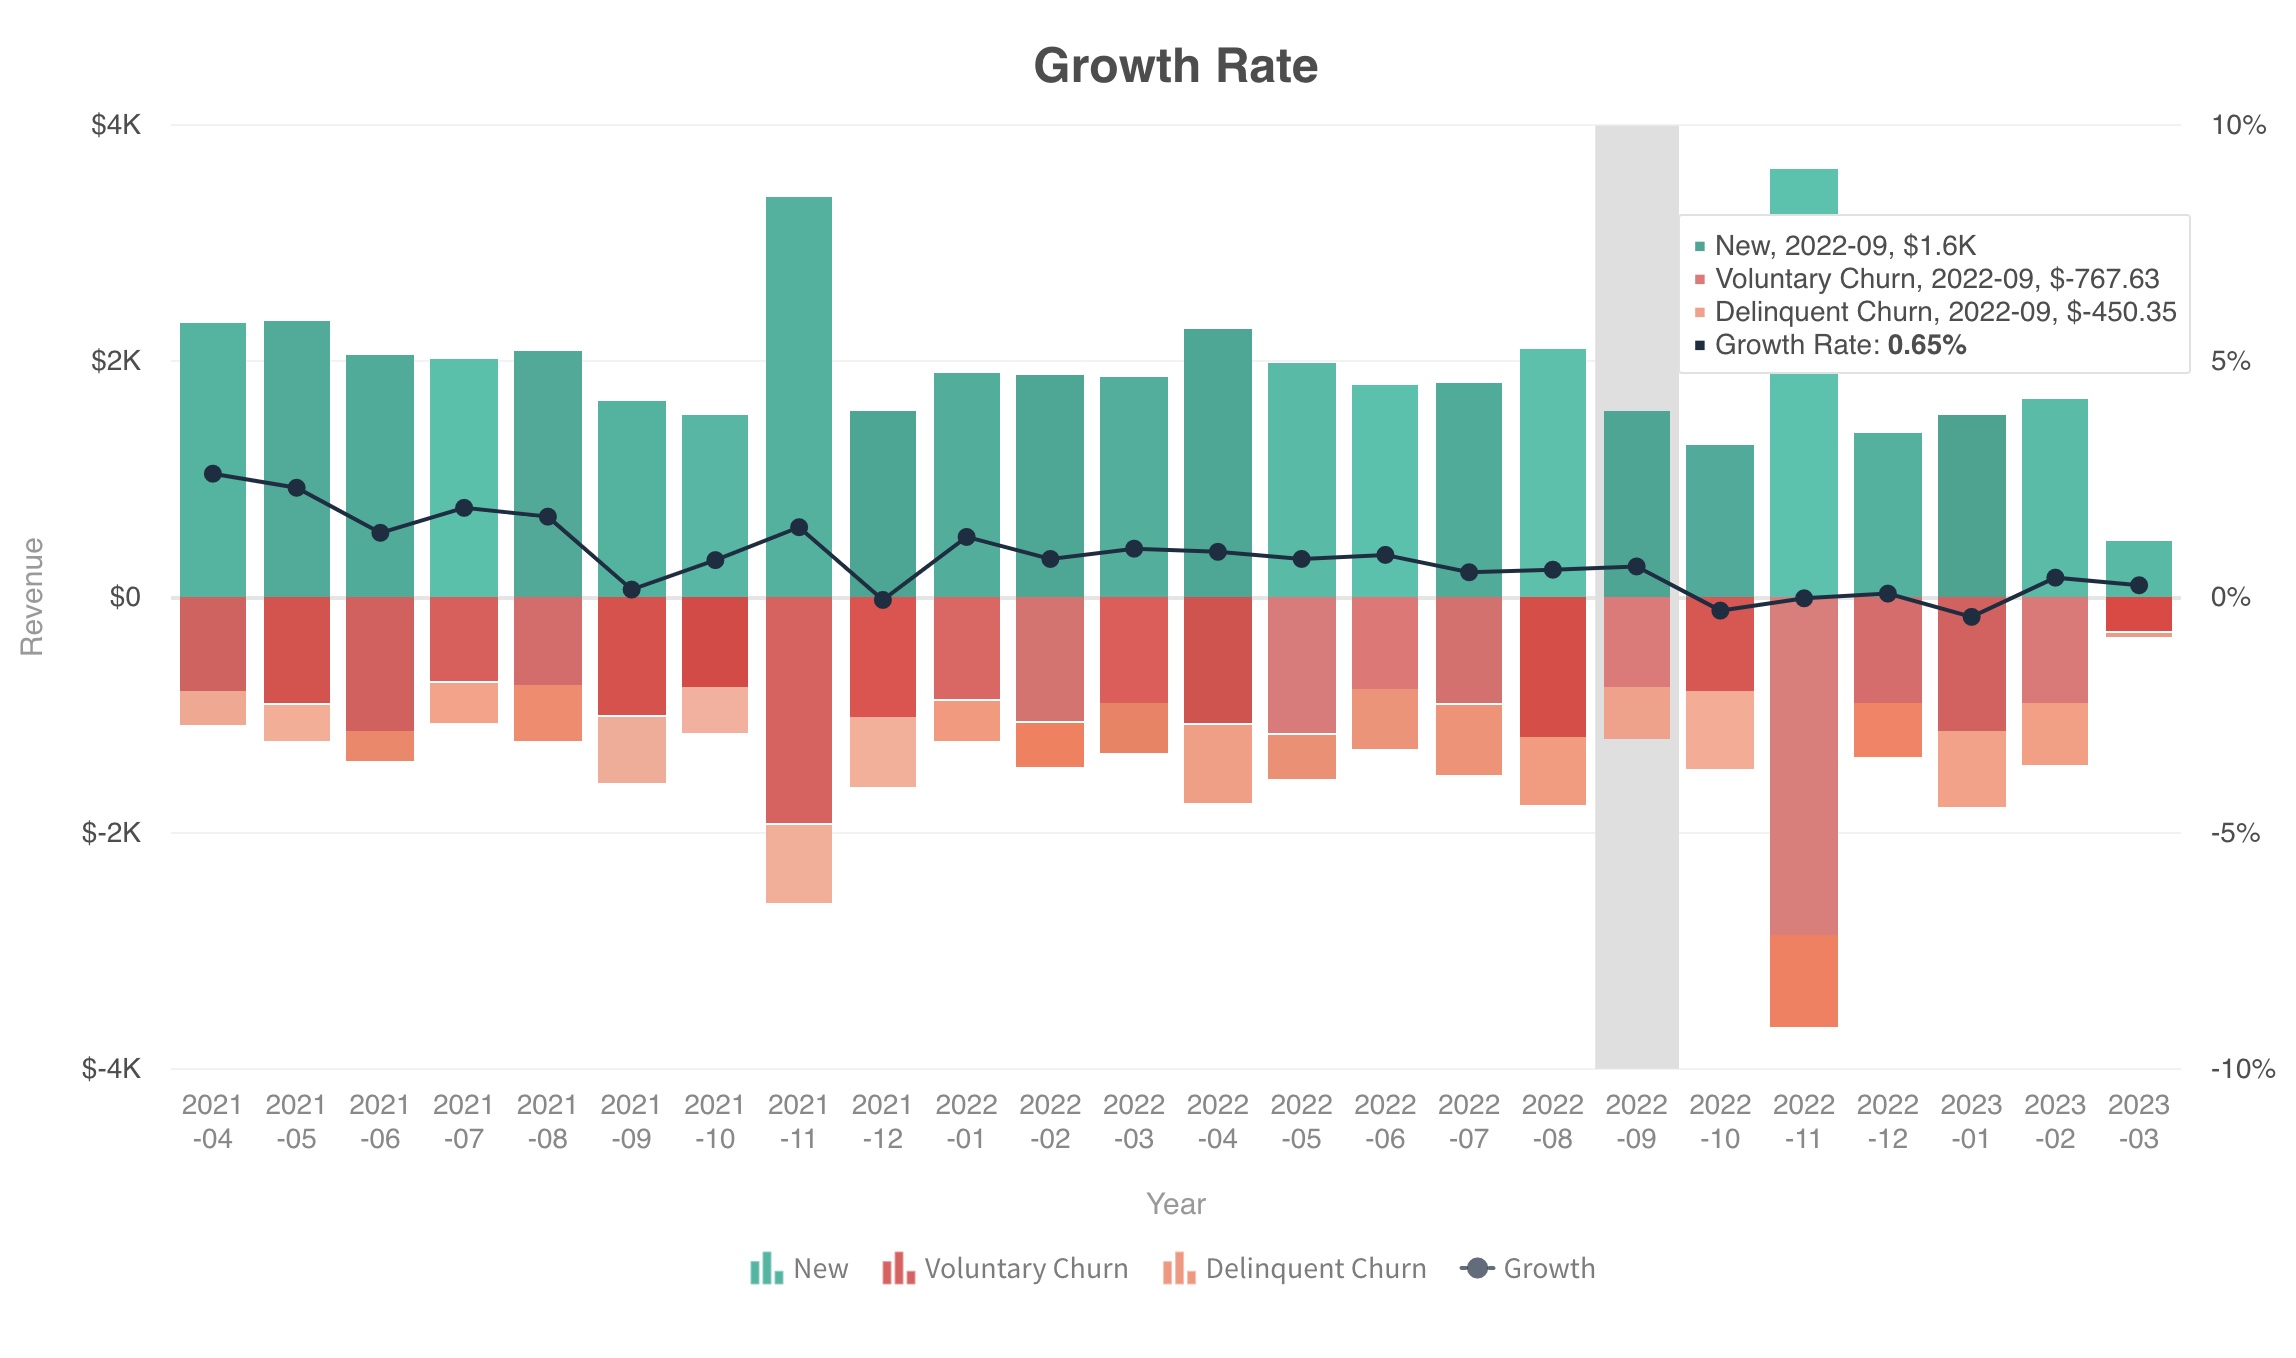
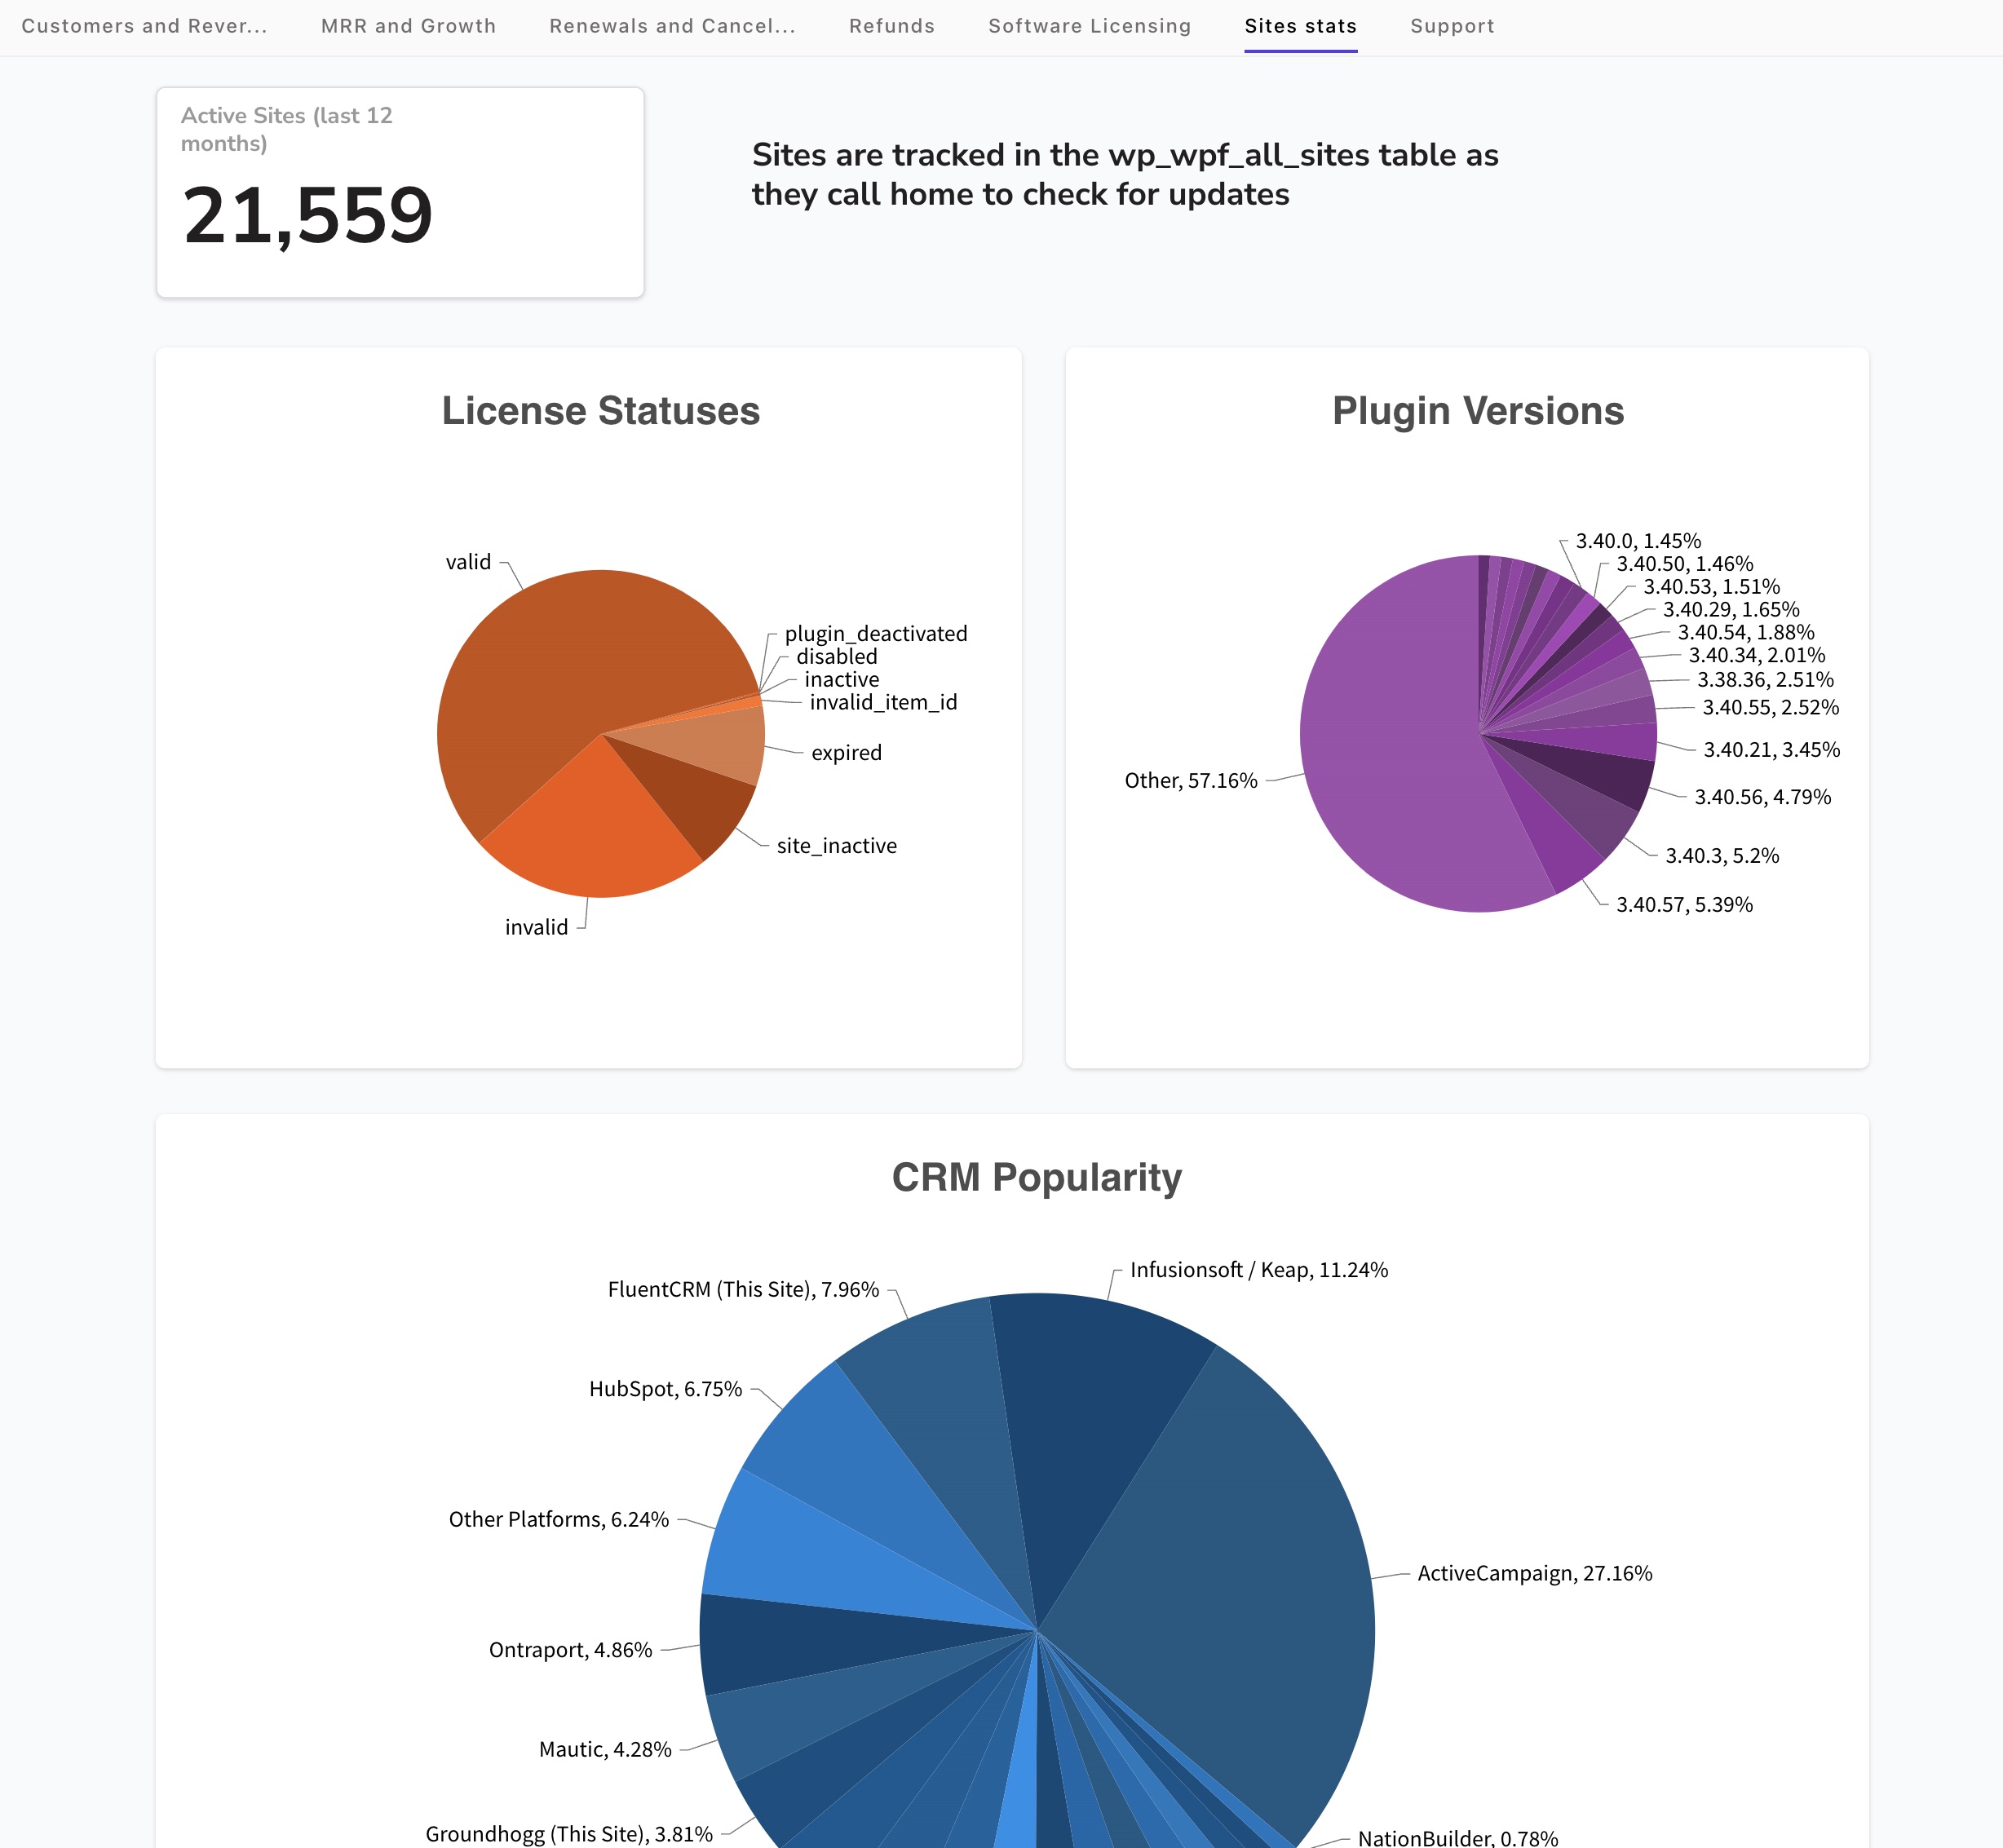
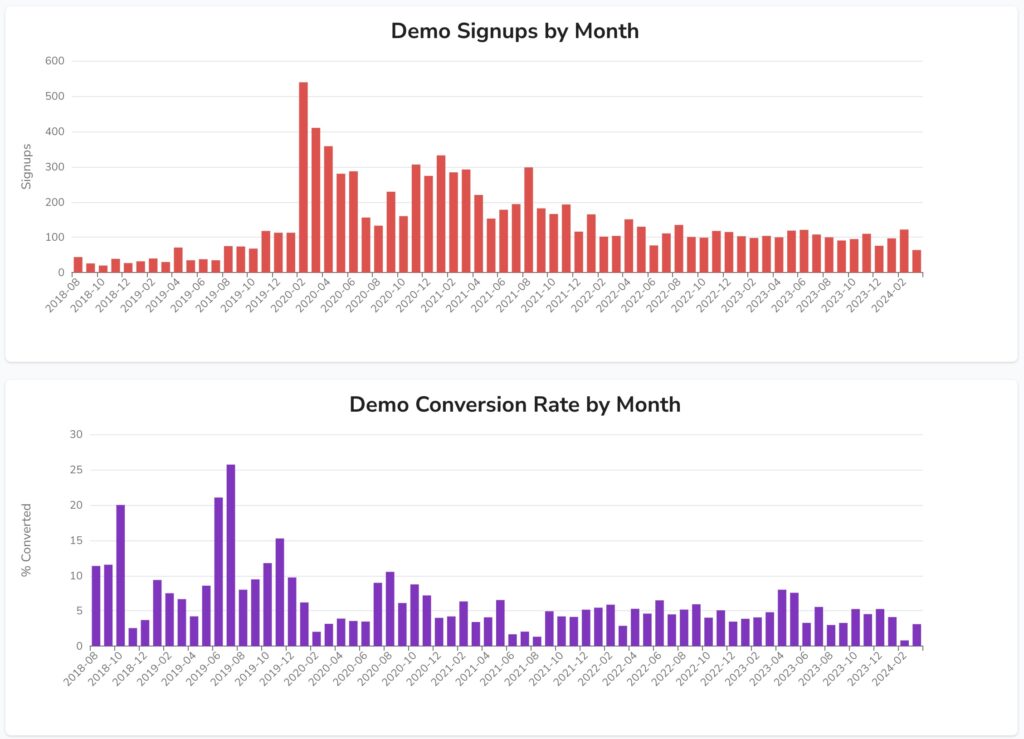
Charts!
You can see more examples in our 2022 in Review, but here are a few highlights.

Cool! I want it! 👋
No problem! You can fork the project on Github, install it in your own Appsmith account, and connect it to your own EDD data in just a few clicks.
If you come up with any cool charts (or find anything funny with our queries 🫢), let us know on Github.
One response to “Creating an analytics dashboard for Easy Digital Downloads using AppSmith and ChatGPT”
Holy sh*t this is useful. Gonna give this a run myself.