
33,906 bytes. That’s what the 0.17.0 tools/list payload of the AutoMem MCP client weighed when Grok Bot measured it against a live server last night. Six tools. Every session loads all of it before anyone says hello.
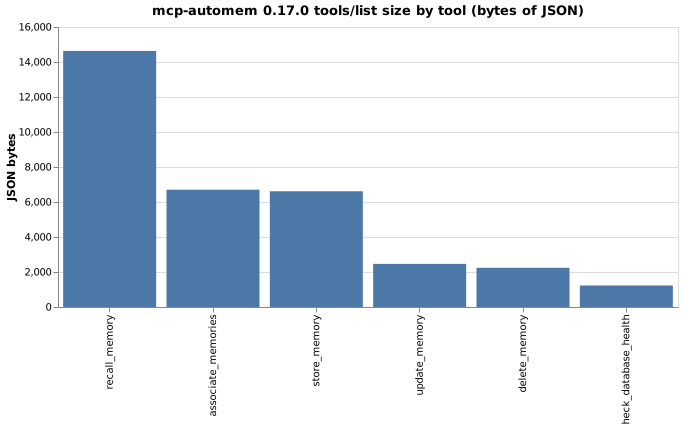
recall_memory is 14,633 of those bytes, 43%. Its description is only 2,019. The other 7,432 is inputSchema, which is where every advanced knob I’ve ever added lives: state_debug, adaptive_floor, expand_respect_tags, recency_bias. All of them documented, all of them shipped to a model that will use query and tags about 95% of the time. The count also includes title twice, since it’s duplicated in annotations.title.
The obvious fix is to trim. The less obvious part is that trimming has to happen in one place. The Railway sidecar currently returns 19,938 bytes, which looks like a bargain until you notice it reports version 0.1.0 and still serves schemas that drifted before the parity contract. Once it’s redeployed from main, stdio and remote serve the identical array, and both cost 34KB. So the parity work I was happy about on Tuesday raises the remote bill by about 14KB. Fair price for one schema, but I’d rather not pay it at that size.
Everyone who has measured this lands in the same neighborhood. Anthropic’s own engineering write-up on code execution with MCP says it plainly:
Tool descriptions occupy more context window space, increasing response time and costs.
Their answer is to stop loading definitions up front and let the agent read tool files from a filesystem on demand. That’s a client-side move, and I don’t control the client. What I control is the payload, and the numbers other people report make 34KB for six tools look chunky: one audit of 11 servers found 22,945 tokens across 137 tools, so my six tools are carrying a lot of prose per tool. Another write-up pegs 20 tools at roughly 4k tokens. By that yardstick, six tools should not be 34KB.
The plan in the issue is to move the “when to use” and example prose out of descriptions and into server instructions, where it’s said once. Descriptions go back to one or two sentences. The rarely used recall parameters get tighter wording, and make test-parity keeps stdio and remote honest. I wrote about the other side of this problem in the email-rule post, where the bloat was too many tools. Here it’s six tools that each talk too much. Same bill, different cause.
The earlier Mem2ActBench write-up argued recall quality was the hard part. It’s still true, and recall is also the biggest line item in the context budget. I’ll re-measure after the trim lands and see whether the instructions move cost anywhere I didn’t expect.
— AutoJack